
-
- Height:
- 6-11
-
- Weight:
- 250
-
- Year:
- So.
-
- Hometown:
- Jenison, Mich.
-
- High School:
- Jenison
-
- Position:
- C
-
- gp
- 27
-
- pts/g
- 3.3
-
- fg %
- 48.3
-
- 3pt %
- 25.0
-
- ft %
- 71.1
-
- reb/g
- 1.7
-
- a/g
- 0.6
Bio

2013-14: Took a big step forward in all parts of his game in his sophomore season, and will compete for a starting spot in 2014-15…Saw action in all 27 games and averaged more than 8 minutes per game…Made all six of his field goals and scored a career-high 15 points in a win over Ohio Dominican Feb. 8…Followed that up with a 12 point, 6 rebound, 3 assist effort in a road win over Lake Erie Feb. 13…Set new career marks with 88 points and 45 rebounds on the season.
2012-13: Big center who figures to see a big uptick in his playing time in 2013-14 after the graduation of four-year starter Nick Washburn…Has a nice outside shooting touch…Played in 17 games as a redshirt-freshman in 2012-13, scoring 40 points while grabbing 21 rebounds…Had 13 points in an impressive outing off the bench Dec. 1 versus Lake Superior State…Shot 10-for-11 from the free throw line (91 percent) for the season.
2011-12: Redshirted as a true freshman.
High School: Team captain and MVP of the Wildcats in 2010-11...First-Team All-OK Red Conference in 2010-11...Earned honorable mention All-State honors from the Detroit Free Press and the Grand Rapids Press...Averaged 15 points, seven rebounds and two assists per game for Jenison as a senior, while playing nearly 30 minutes per game...Named his team’s most improved player in 2009-10...Named his school’s Athlete of the Month three times during his prep career...Played AAU basketball for the Grand Rapids Storm under coach Jason Martin...Team won two tournaments in 2011 and took second twice in 2009, once in a tournament with 170 teams...Born May 5, 1993...Parents are Scott and Della...Named to the honor roll in all four years in high school.
Player Profile
| Overall | Conf | |||
|---|---|---|---|---|
| Games | 27 | 22 | ||
| Games started | 1 | 1 | ||
| Minutes | 223 | 175 | ||
| Minutes per game | 8.3 | 8.0 | ||
| FG | 29-60 | 22-45 | ||
| FG Pct | 48.3 | 48.9 | ||
| 3PT | 3-12 | 2-7 | ||
| 3PT Pct | 25.0 | 28.6 | ||
| FT | 27-38 | 19-28 | ||
| FT Pct | 71.1 | 67.9 | ||
| Off rebounds | 12 | 7 | ||
| Def rebounds | 33 | 27 | ||
| Total rebounds | 45 | 34 | ||
| Rebounds per game | 1.7 | 1.5 | ||
| Personal fouls | 45 | 41 | ||
| Disqualifications | 0 | 0 | ||
| Assists | 16 | 15 | ||
| Turnovers | 22 | 19 | ||
| Assist to turnover ratio | 0.7 | 0.8 | ||
| Steals | 2 | 1 | ||
| Blocks | 3 | 3 | ||
| Points | 88 | 65 | ||
| Points per game | 3.3 | 3.0 | ||
| Points per 40 min | 15.8 | 14.9 | ||
Game Log - Shooting
| Date | Opponent | Score | gs | min | fg | pct | 3pt | pct | ft | pct | pts |
|---|---|---|---|---|---|---|---|---|---|---|---|
| Oct 26 | at Valparaiso | L, 69-60 | - | - | - | - | - | - | - | - | - |
| Nov 2 | at Grace (Neb.) | W, 81-80 | - | - | - | - | - | - | - | - | - |
| Nov 3 | at Toledo | L, 85-84 | - | - | - | - | - | - | - | - | - |
| Nov 4 | at Indiana | L, 79-39 | - | - | - | - | - | - | - | - | - |
| Nov 13 | Lourdes | W, 88-64 | - | 19 | 2-4 | 50.0 | 0-2 | 0.0 | 5-6 | 83.3 | 9 |
| Nov 26 | Cedarville | W, 76-59 | - | 8 | 2-4 | 50.0 | 0-1 | 0.0 | 0-0 | - | 4 |
| Dec 5 | at Northwood (Mich.) | L, 60-55 | - | 9 | 1-3 | 33.3 | 0-0 | - | 2-3 | 66.7 | 4 |
| Dec 7 | at Lake Superior St. | L, 89-80 | - | 8 | 0-1 | 0.0 | 0-0 | - | 1-2 | 50.0 | 1 |
| Dec 14 | Michigan Tech | L, 84-81 | - | 2 | 0-0 | - | 0-0 | - | 0-0 | - | 0 |
| Dec 16 | Northern Mich. | W, 88-64 | - | 6 | 1-3 | 33.3 | 0-0 | - | 1-3 | 33.3 | 3 |
| Dec 21 | vs. Truman | W, 66-49 | - | 7 | 2-2 | 100.0 | 1-1 | 100.0 | 0-0 | - | 5 |
| Dec 22 | at Quincy | W, 75-64 | - | 4 | 0-1 | 0.0 | 0-1 | 0.0 | 0-0 | - | 0 |
| Jan 2 | at Grand Valley St. | W, 68-66 | - | 8 | 0-0 | - | 0-0 | - | 1-2 | 50.0 | 1 |
| Jan 4 | at Ferris St. | W, 72-59 | - | 9 | 0-2 | 0.0 | 0-1 | 0.0 | 1-2 | 50.0 | 1 |
| Jan 9 | Wayne St. (Mich.) | W, 69-67 | 1 | 8 | 1-1 | 100.0 | 1-1 | 100.0 | 0-0 | - | 3 |
| Jan 11 | Saginaw Valley | W, 73-57 | - | 6 | 0-0 | - | 0-0 | - | 0-0 | - | 0 |
| Jan 16 | Tiffin | W, 67-58 | - | 14 | 1-5 | 20.0 | 0-2 | 0.0 | 4-5 | 80.0 | 6 |
| Jan 18 | at Ohio Dominican | L, 57-55 | - | 16 | 2-5 | 40.0 | 0-0 | - | 2-2 | 100.0 | 6 |
| Jan 23 | Lake Erie | W, 66-48 | - | 7 | 1-1 | 100.0 | 0-0 | - | 1-3 | 33.3 | 3 |
| Jan 25 | Ashland | W, 85-74 | - | 3 | 0-0 | - | 0-0 | - | 0-0 | - | 0 |
| Jan 30 | Malone | W, 86-71 | - | 12 | 0-0 | - | 0-0 | - | 0-0 | - | 0 |
| Feb 1 | at Walsh | L, 82-58 | - | 4 | 0-1 | 0.0 | 0-1 | 0.0 | 0-0 | - | 0 |
| Feb 3 | at Findlay | L, 74-71 | - | 2 | 0-0 | - | 0-0 | - | 0-0 | - | 0 |
| Feb 6 | at Tiffin | L, 75-70 | - | 1 | 1-1 | 100.0 | 0-0 | - | 0-0 | - | 2 |
| Feb 8 | Ohio Dominican | W, 87-56 | - | 12 | 6-6 | 100.0 | 1-1 | 100.0 | 2-2 | 100.0 | 15 |
| Feb 13 | at Lake Erie | W, 75-59 | - | 20 | 5-8 | 62.5 | 0-0 | - | 2-2 | 100.0 | 12 |
| Feb 15 | at Ashland | W, 64-61 | - | 6 | 0-1 | 0.0 | 0-0 | - | 2-2 | 100.0 | 2 |
| Feb 20 | at Malone | L, 81-80 | - | 7 | 1-2 | 50.0 | 0-0 | - | 0-0 | - | 2 |
| Feb 22 | Walsh | W, 86-73 | - | 7 | 1-4 | 25.0 | 0-1 | 0.0 | 0-0 | - | 2 |
| Feb 27 | Findlay | W, 86-67 | - | 8 | 1-1 | 100.0 | 0-0 | - | 0-0 | - | 2 |
| Mar 5 | at Findlay | L, 67-47 | - | 10 | 1-4 | 25.0 | 0-0 | - | 3-4 | 75.0 | 5 |
Game Log - Ball control
| Date | Opponent | Score | gs | min | off | def | reb | ast | to | a/to | stl | blk | pf | dq |
|---|---|---|---|---|---|---|---|---|---|---|---|---|---|---|
| Oct 26 | at Valparaiso | L, 69-60 | - | - | - | - | - | - | - | - | - | - | - | - |
| Nov 2 | at Grace (Neb.) | W, 81-80 | - | - | - | - | - | - | - | - | - | - | - | - |
| Nov 3 | at Toledo | L, 85-84 | - | - | - | - | - | - | - | - | - | - | - | - |
| Nov 4 | at Indiana | L, 79-39 | - | - | - | - | - | - | - | - | - | - | - | - |
| Nov 13 | Lourdes | W, 88-64 | - | 19 | 4 | 4 | 8 | 1 | 1 | 1.0 | 1 | 0 | 1 | 0 |
| Nov 26 | Cedarville | W, 76-59 | - | 8 | 0 | 0 | 0 | 0 | 1 | 0.0 | 0 | 0 | 0 | 0 |
| Dec 5 | at Northwood (Mich.) | L, 60-55 | - | 9 | 0 | 1 | 1 | 0 | 1 | 0.0 | 0 | 0 | 0 | 0 |
| Dec 7 | at Lake Superior St. | L, 89-80 | - | 8 | 0 | 0 | 0 | 0 | 0 | - | 0 | 0 | 3 | 0 |
| Dec 14 | Michigan Tech | L, 84-81 | - | 2 | 0 | 0 | 0 | 0 | 0 | - | 0 | 0 | 1 | 0 |
| Dec 16 | Northern Mich. | W, 88-64 | - | 6 | 0 | 0 | 0 | 0 | 0 | - | 0 | 0 | 1 | 0 |
| Dec 21 | vs. Truman | W, 66-49 | - | 7 | 0 | 1 | 1 | 0 | 1 | 0.0 | 0 | 0 | 1 | 0 |
| Dec 22 | at Quincy | W, 75-64 | - | 4 | 0 | 1 | 1 | 0 | 0 | - | 0 | 0 | 1 | 0 |
| Jan 2 | at Grand Valley St. | W, 68-66 | - | 8 | 0 | 1 | 1 | 1 | 1 | 1.0 | 0 | 0 | 2 | 0 |
| Jan 4 | at Ferris St. | W, 72-59 | - | 9 | 0 | 1 | 1 | 0 | 1 | 0.0 | 0 | 1 | 1 | 0 |
| Jan 9 | Wayne St. (Mich.) | W, 69-67 | 1 | 8 | 0 | 2 | 2 | 0 | 0 | - | 0 | 1 | 4 | 0 |
| Jan 11 | Saginaw Valley | W, 73-57 | - | 6 | 0 | 0 | 0 | 0 | 2 | 0.0 | 0 | 0 | 1 | 0 |
| Jan 16 | Tiffin | W, 67-58 | - | 14 | 2 | 4 | 6 | 2 | 0 | - | 0 | 0 | 1 | 0 |
| Jan 18 | at Ohio Dominican | L, 57-55 | - | 16 | 0 | 2 | 2 | 0 | 1 | 0.0 | 0 | 0 | 2 | 0 |
| Jan 23 | Lake Erie | W, 66-48 | - | 7 | 0 | 2 | 2 | 2 | 1 | 2.0 | 0 | 0 | 4 | 0 |
| Jan 25 | Ashland | W, 85-74 | - | 3 | 0 | 1 | 1 | 0 | 1 | 0.0 | 1 | 0 | 2 | 0 |
| Jan 30 | Malone | W, 86-71 | - | 12 | 0 | 1 | 1 | 0 | 2 | 0.0 | 0 | 0 | 0 | - |
| Feb 1 | at Walsh | L, 82-58 | - | 4 | 0 | 1 | 1 | 0 | 0 | - | 0 | 0 | 0 | 0 |
| Feb 3 | at Findlay | L, 74-71 | - | 2 | 0 | 0 | 0 | 0 | 0 | - | 0 | 0 | 1 | - |
| Feb 6 | at Tiffin | L, 75-70 | - | 1 | 0 | 1 | 1 | 0 | 0 | - | 0 | 0 | 0 | 0 |
| Feb 8 | Ohio Dominican | W, 87-56 | - | 12 | 0 | 3 | 3 | 2 | 1 | 2.0 | 0 | 0 | 4 | - |
| Feb 13 | at Lake Erie | W, 75-59 | - | 20 | 3 | 3 | 6 | 3 | 1 | 3.0 | 0 | 0 | 3 | - |
| Feb 15 | at Ashland | W, 64-61 | - | 6 | 0 | 1 | 1 | 0 | 1 | 0.0 | 0 | 0 | 4 | 0 |
| Feb 20 | at Malone | L, 81-80 | - | 7 | 1 | 0 | 1 | 2 | 2 | 1.0 | 0 | 1 | 2 | - |
| Feb 22 | Walsh | W, 86-73 | - | 7 | 0 | 2 | 2 | 2 | 2 | 1.0 | 0 | 0 | 4 | - |
| Feb 27 | Findlay | W, 86-67 | - | 8 | 1 | 1 | 2 | 1 | 2 | 0.5 | 0 | 0 | 1 | - |
| Mar 5 | at Findlay | L, 67-47 | - | 10 | 1 | 0 | 1 | 0 | 0 | - | 0 | 0 | 1 | 0 |
Career Stats - Shooting per game
| gp | gs | min/g | fg/g | pct | 3pt/g | pct | ft/g | pct | ppg | |
|---|---|---|---|---|---|---|---|---|---|---|
| 2011-12 | - | - | - | 0.0-0.0 | - | 0.0-0.0 | - | 0.0-0.0 | - | - |
| 2012-13 | 17 | - | 4.4 | 0.8-1.9 | 40.6 | 0.2-0.8 | 28.6 | 0.6-0.6 | 90.9 | 2.4 |
| 2013-14 | 27 | 1 | 8.3 | 1.1-2.2 | 48.3 | 0.1-0.4 | 25.0 | 1.0-1.4 | 71.1 | 3.3 |
| 2014-15 | 26 | 14 | 14.9 | 2.5-4.9 | 50.4 | 0.4-1.3 | 30.3 | 1.3-1.8 | 73.9 | 6.6 |
| 2015-16 | 28 | 28 | 20.1 | 3.7-7.0 | 53.3 | 0.9-2.4 | 39.4 | 1.6-2.1 | 75.9 | 9.9 |
| Total | 98 | 43 | 12.7 | 2.1-4.2 | 50.7 | 0.4-1.3 | 34.4 | 1.2-1.6 | 75.2 | 5.9 |
Career Stats - Shooting totals
| gp | gs | min | fg | pct | 3pt | pct | ft | pct | pts | |
|---|---|---|---|---|---|---|---|---|---|---|
| 2011-12 | - | - | - | 0-0 | - | 0-0 | - | 0-0 | - | 0 |
| 2012-13 | 17 | - | 74 | 13-32 | 40.6 | 4-14 | 28.6 | 10-11 | 90.9 | 40 |
| 2013-14 | 27 | 1 | 223 | 29-60 | 48.3 | 3-12 | 25.0 | 27-38 | 71.1 | 88 |
| 2014-15 | 26 | 14 | 388 | 64-127 | 50.4 | 10-33 | 30.3 | 34-46 | 73.9 | 172 |
| 2015-16 | 28 | 28 | 562 | 104-195 | 53.3 | 26-66 | 39.4 | 44-58 | 75.9 | 278 |
| Total | 98 | 43 | 1247 | 210-414 | 50.7 | 43-125 | 34.4 | 115-153 | 75.2 | 578 |
Career Stats - Shooting per 40 min
| gp | gs | min/g | fg/40 | pct | 3pt/40 | pct | ft/40 | pct | pts/40 | |
|---|---|---|---|---|---|---|---|---|---|---|
| 2011-12 | - | - | - | 0.0-0.0 | - | 0.0-0.0 | - | 0.0-0.0 | - | - |
| 2012-13 | 17 | - | 4.4 | 7.0-17.3 | 40.6 | 2.2-7.6 | 28.6 | 5.4-5.9 | 90.9 | 21.6 |
| 2013-14 | 27 | 1 | 8.3 | 5.2-10.8 | 48.3 | 0.5-2.2 | 25.0 | 4.8-6.8 | 71.1 | 15.8 |
| 2014-15 | 26 | 14 | 14.9 | 6.6-13.1 | 50.4 | 1.0-3.4 | 30.3 | 3.5-4.7 | 73.9 | 17.7 |
| 2015-16 | 28 | 28 | 20.1 | 7.4-13.9 | 53.3 | 1.9-4.7 | 39.4 | 3.1-4.1 | 75.9 | 19.8 |
| Total | 98 | 43 | 12.7 | 6.7-13.3 | 50.7 | 1.4-4.0 | 34.4 | 3.7-4.9 | 75.2 | 18.5 |
Career Stats - Ball control per game
| gp | gs | mpg | off/g | def/g | reb/g | pf/g | dq/g | ast/g | to/g | a/to | stl/g | blk/g | |
|---|---|---|---|---|---|---|---|---|---|---|---|---|---|
| 2011-12 | - | - | - | - | - | - | - | - | - | - | - | - | - |
| 2012-13 | 17 | - | 4.4 | 0.2 | 1.0 | 1.2 | 0.6 | 0.0 | 0.4 | 0.2 | 1.8 | 0.0 | 0.0 |
| 2013-14 | 27 | 1 | 8.3 | 0.4 | 1.2 | 1.7 | 1.7 | 0.0 | 0.6 | 0.8 | 0.7 | 0.1 | 0.1 |
| 2014-15 | 26 | 14 | 14.9 | 0.7 | 2.8 | 3.5 | 1.9 | 0.0 | 1.0 | 1.1 | 0.9 | 0.2 | 0.3 |
| 2015-16 | 28 | 28 | 20.1 | 0.5 | 3.5 | 4.0 | 2.3 | 0.1 | 1.9 | 1.2 | 1.6 | 0.4 | 0.2 |
| Total | 98 | 43 | 12.7 | 0.5 | 2.3 | 2.8 | 1.7 | 0.0 | 1.0 | 0.9 | 1.1 | 0.2 | 0.2 |
Career Stats - Ball control totals
| gp | gs | min | off | def | reb | pf | dq | ast | to | a/to | stl | blk | |
|---|---|---|---|---|---|---|---|---|---|---|---|---|---|
| 2011-12 | - | - | - | - | - | - | - | - | - | - | - | - | - |
| 2012-13 | 17 | - | 74 | 4 | 17 | 21 | 11 | 0 | 7 | 4 | 1.8 | 0 | 0 |
| 2013-14 | 27 | 1 | 223 | 12 | 33 | 45 | 45 | 0 | 16 | 22 | 0.7 | 2 | 3 |
| 2014-15 | 26 | 14 | 388 | 18 | 73 | 91 | 49 | 0 | 25 | 29 | 0.9 | 6 | 9 |
| 2015-16 | 28 | 28 | 562 | 14 | 99 | 113 | 64 | 3 | 54 | 34 | 1.6 | 12 | 5 |
| Total | 98 | 43 | 1247 | 48 | 222 | 270 | 169 | 3 | 102 | 89 | 1.1 | 20 | 17 |
Career Stats - Ball control per 40 min
| gp | gs | mpg | off/40 | def/40 | reb/40 | pf/40 | dq/40 | ast/40 | to/40 | a/to | stl/40 | blk/40 | |
|---|---|---|---|---|---|---|---|---|---|---|---|---|---|
| 2011-12 | - | - | - | - | - | - | - | - | - | - | - | - | - |
| 2012-13 | 17 | - | 4.4 | 2.2 | 9.2 | 11.4 | 5.9 | 0.0 | 3.8 | 2.2 | 1.8 | 0.0 | 0.0 |
| 2013-14 | 27 | 1 | 8.3 | 2.2 | 5.9 | 8.1 | 8.1 | 0.0 | 2.9 | 3.9 | 0.7 | 0.4 | 0.5 |
| 2014-15 | 26 | 14 | 14.9 | 1.9 | 7.5 | 9.4 | 5.1 | 0.0 | 2.6 | 3.0 | 0.9 | 0.6 | 0.9 |
| 2015-16 | 28 | 28 | 20.1 | 1.0 | 7.0 | 8.0 | 4.6 | 0.2 | 3.8 | 2.4 | 1.6 | 0.9 | 0.4 |
| Total | 98 | 43 | 12.7 | 1.5 | 7.1 | 8.7 | 5.4 | 0.1 | 3.3 | 2.9 | 1.1 | 0.6 | 0.5 |
Splits Stats - Shooting per game
| gp | gs | min/g | fg/g | pct | 3pt/g | pct | ft/g | pct | ppg | ||
|---|---|---|---|---|---|---|---|---|---|---|---|
| Event | Total | 27 | 1 | 8.3 | 1.1-2.2 | 48.3 | 0.1-0.4 | 25.0 | 1.0-1.4 | 71.1 | 3.3 |
| Conference | 22 | 1 | 8.0 | 1.0-2.0 | 48.9 | 0.1-0.3 | 28.6 | 0.9-1.3 | 67.9 | 3.0 | |
| Exhibition | - | - | - | 0.0-0.0 | - | 0.0-0.0 | - | 0.0-0.0 | - | - | |
| Location | Home | 13 | 1 | 8.6 | 1.2-2.2 | 55.2 | 0.2-0.6 | 25.0 | 1.0-1.5 | 68.4 | 3.6 |
| Away | 13 | - | 8.0 | 0.8-2.2 | 37.9 | 0.0-0.2 | 0.0 | 1.1-1.5 | 73.7 | 2.8 | |
| Neutral | 1 | - | 7.0 | 2.0-2.0 | 100.0 | 1.0-1.0 | 100.0 | 0.0-0.0 | - | 5.0 | |
| Result | Wins | 18 | 1 | 9.1 | 1.3-2.4 | 53.5 | 0.2-0.6 | 27.3 | 1.1-1.5 | 70.4 | 3.8 |
| Losses | 9 | - | 6.6 | 0.7-1.9 | 35.3 | 0.0-0.1 | 0.0 | 0.9-1.2 | 72.7 | 2.2 | |
| Month | November | 2 | - | 13.5 | 2.0-4.0 | 50.0 | 0.0-1.5 | 0.0 | 2.5-3.0 | 83.3 | 6.5 |
| December | 6 | - | 6.0 | 0.7-1.7 | 40.0 | 0.2-0.3 | 50.0 | 0.7-1.3 | 50.0 | 2.2 | |
| January | 9 | 1 | 9.2 | 0.6-1.6 | 35.7 | 0.1-0.4 | 25.0 | 1.0-1.6 | 64.3 | 2.2 | |
| February | 9 | - | 7.4 | 1.7-2.7 | 62.5 | 0.1-0.3 | 33.3 | 0.7-0.7 | 100.0 | 4.1 | |
| March | 1 | - | 10.0 | 1.0-4.0 | 25.0 | 0.0-0.0 | - | 3.0-4.0 | 75.0 | 5.0 |
Splits Stats - Shooting totals
| gp | gs | min | fg | pct | 3pt | pct | ft | pct | pts | ||
|---|---|---|---|---|---|---|---|---|---|---|---|
| Event | Total | 27 | 1 | 223 | 29-60 | 48.3 | 3-12 | 25.0 | 27-38 | 71.1 | 88 |
| Conference | 22 | 1 | 175 | 22-45 | 48.9 | 2-7 | 28.6 | 19-28 | 67.9 | 65 | |
| Exhibition | - | - | - | 0-0 | - | 0-0 | - | 0-0 | - | 0 | |
| Location | Home | 13 | 1 | 112 | 16-29 | 55.2 | 2-8 | 25.0 | 13-19 | 68.4 | 47 |
| Away | 13 | - | 104 | 11-29 | 37.9 | 0-3 | 0.0 | 14-19 | 73.7 | 36 | |
| Neutral | 1 | - | 7 | 2-2 | 100.0 | 1-1 | 100.0 | 0-0 | - | 5 | |
| Result | Wins | 18 | 1 | 164 | 23-43 | 53.5 | 3-11 | 27.3 | 19-27 | 70.4 | 68 |
| Losses | 9 | - | 59 | 6-17 | 35.3 | 0-1 | 0.0 | 8-11 | 72.7 | 20 | |
| Month | November | 2 | - | 27 | 4-8 | 50.0 | 0-3 | 0.0 | 5-6 | 83.3 | 13 |
| December | 6 | - | 36 | 4-10 | 40.0 | 1-2 | 50.0 | 4-8 | 50.0 | 13 | |
| January | 9 | 1 | 83 | 5-14 | 35.7 | 1-4 | 25.0 | 9-14 | 64.3 | 20 | |
| February | 9 | - | 67 | 15-24 | 62.5 | 1-3 | 33.3 | 6-6 | 100.0 | 37 | |
| March | 1 | - | 10 | 1-4 | 25.0 | 0-0 | - | 3-4 | 75.0 | 5 |
Splits Stats - Shooting per 40 min
| gp | gs | min/g | fg/40 | pct | 3pt/40 | pct | ft/40 | pct | pts/40 | ||
|---|---|---|---|---|---|---|---|---|---|---|---|
| Event | Total | 27 | 1 | 8.3 | 5.2-10.8 | 48.3 | 0.5-2.2 | 25.0 | 4.8-6.8 | 71.1 | 15.8 |
| Conference | 22 | 1 | 8.0 | 5.0-10.3 | 48.9 | 0.5-1.6 | 28.6 | 4.3-6.4 | 67.9 | 14.9 | |
| Exhibition | - | - | - | 0.0-0.0 | - | 0.0-0.0 | - | 0.0-0.0 | - | - | |
| Location | Home | 13 | 1 | 8.6 | 5.7-10.4 | 55.2 | 0.7-2.9 | 25.0 | 4.6-6.8 | 68.4 | 16.8 |
| Away | 13 | - | 8.0 | 4.2-11.2 | 37.9 | 0.0-1.2 | 0.0 | 5.4-7.3 | 73.7 | 13.8 | |
| Neutral | 1 | - | 7.0 | 11.4-11.4 | 100.0 | 5.7-5.7 | 100.0 | 0.0-0.0 | - | 28.6 | |
| Result | Wins | 18 | 1 | 9.1 | 5.6-10.5 | 53.5 | 0.7-2.7 | 27.3 | 4.6-6.6 | 70.4 | 16.6 |
| Losses | 9 | - | 6.6 | 4.1-11.5 | 35.3 | 0.0-0.7 | 0.0 | 5.4-7.5 | 72.7 | 13.6 | |
| Month | November | 2 | - | 13.5 | 5.9-11.9 | 50.0 | 0.0-4.4 | 0.0 | 7.4-8.9 | 83.3 | 19.3 |
| December | 6 | - | 6.0 | 4.4-11.1 | 40.0 | 1.1-2.2 | 50.0 | 4.4-8.9 | 50.0 | 14.4 | |
| January | 9 | 1 | 9.2 | 2.4-6.7 | 35.7 | 0.5-1.9 | 25.0 | 4.3-6.7 | 64.3 | 9.6 | |
| February | 9 | - | 7.4 | 9.0-14.3 | 62.5 | 0.6-1.8 | 33.3 | 3.6-3.6 | 100.0 | 22.1 | |
| March | 1 | - | 10.0 | 4.0-16.0 | 25.0 | 0.0-0.0 | - | 12.0-16.0 | 75.0 | 20.0 |
Splits Stats - Ball control per game
| gp | gs | mpg | off/g | def/g | reb/g | pf/g | dq/g | ast/g | to/g | a/to | stl/g | blk/g | ||
|---|---|---|---|---|---|---|---|---|---|---|---|---|---|---|
| Event | Total | 27 | 1 | 8.3 | 0.4 | 1.2 | 1.7 | 1.7 | 0.0 | 0.6 | 0.8 | 0.7 | 0.1 | 0.1 |
| Conference | 22 | 1 | 8.0 | 0.3 | 1.2 | 1.5 | 1.9 | 0.0 | 0.7 | 0.9 | 0.8 | 0.0 | 0.1 | |
| Exhibition | - | - | - | - | - | - | - | - | - | - | - | - | - | |
| Location | Home | 13 | 1 | 8.6 | 0.5 | 1.5 | 2.1 | 1.8 | 0.0 | 0.8 | 1.0 | 0.8 | 0.2 | 0.1 |
| Away | 13 | - | 8.0 | 0.4 | 0.9 | 1.3 | 1.5 | 0.0 | 0.5 | 0.6 | 0.8 | 0.0 | 0.2 | |
| Neutral | 1 | - | 7.0 | 0.0 | 1.0 | 1.0 | 1.0 | 0.0 | 0.0 | 1.0 | 0.0 | 0.0 | 0.0 | |
| Result | Wins | 18 | 1 | 9.1 | 0.6 | 1.6 | 2.1 | 1.9 | 0.0 | 0.8 | 1.0 | 0.8 | 0.1 | 0.1 |
| Losses | 9 | - | 6.6 | 0.2 | 0.6 | 0.8 | 1.1 | 0.0 | 0.2 | 0.4 | 0.5 | 0.0 | 0.1 | |
| Month | November | 2 | - | 13.5 | 2.0 | 2.0 | 4.0 | 0.5 | 0.0 | 0.5 | 1.0 | 0.5 | 0.5 | 0.0 |
| December | 6 | - | 6.0 | 0.0 | 0.5 | 0.5 | 1.2 | 0.0 | 0.0 | 0.3 | 0.0 | 0.0 | 0.0 | |
| January | 9 | 1 | 9.2 | 0.2 | 1.6 | 1.8 | 1.9 | 0.0 | 0.6 | 1.0 | 0.6 | 0.1 | 0.2 | |
| February | 9 | - | 7.4 | 0.6 | 1.3 | 1.9 | 2.1 | 0.0 | 1.1 | 1.0 | 1.1 | 0.0 | 0.1 | |
| March | 1 | - | 10.0 | 1.0 | 0.0 | 1.0 | 1.0 | 0.0 | 0.0 | 0.0 | - | 0.0 | 0.0 |
Splits Stats - Ball control totals
| gp | gs | min | off | def | reb | pf | dq | ast | to | a/to | stl | blk | ||
|---|---|---|---|---|---|---|---|---|---|---|---|---|---|---|
| Event | Total | 27 | 1 | 223 | 12 | 33 | 45 | 45 | 0 | 16 | 22 | 0.7 | 2 | 3 |
| Conference | 22 | 1 | 175 | 7 | 27 | 34 | 41 | 0 | 15 | 19 | 0.8 | 1 | 3 | |
| Exhibition | - | - | - | - | - | - | - | - | - | - | - | - | - | |
| Location | Home | 13 | 1 | 112 | 7 | 20 | 27 | 24 | 0 | 10 | 13 | 0.8 | 2 | 1 |
| Away | 13 | - | 104 | 5 | 12 | 17 | 20 | 0 | 6 | 8 | 0.8 | 0 | 2 | |
| Neutral | 1 | - | 7 | 0 | 1 | 1 | 1 | 0 | 0 | 1 | 0.0 | 0 | 0 | |
| Result | Wins | 18 | 1 | 164 | 10 | 28 | 38 | 35 | 0 | 14 | 18 | 0.8 | 2 | 2 |
| Losses | 9 | - | 59 | 2 | 5 | 7 | 10 | 0 | 2 | 4 | 0.5 | 0 | 1 | |
| Month | November | 2 | - | 27 | 4 | 4 | 8 | 1 | 0 | 1 | 2 | 0.5 | 1 | 0 |
| December | 6 | - | 36 | 0 | 3 | 3 | 7 | 0 | 0 | 2 | 0.0 | 0 | 0 | |
| January | 9 | 1 | 83 | 2 | 14 | 16 | 17 | 0 | 5 | 9 | 0.6 | 1 | 2 | |
| February | 9 | - | 67 | 5 | 12 | 17 | 19 | 0 | 10 | 9 | 1.1 | 0 | 1 | |
| March | 1 | - | 10 | 1 | 0 | 1 | 1 | 0 | 0 | 0 | - | 0 | 0 |
Splits Stats - Ball control per 40 min
| gp | gs | mpg | off/40 | def/40 | reb/40 | pf/40 | dq/40 | ast/40 | to/40 | a/to | stl/40 | blk/40 | ||
|---|---|---|---|---|---|---|---|---|---|---|---|---|---|---|
| Event | Total | 27 | 1 | 8.3 | 2.2 | 5.9 | 8.1 | 8.1 | 0.0 | 2.9 | 3.9 | 0.7 | 0.4 | 0.5 |
| Conference | 22 | 1 | 8.0 | 1.6 | 6.2 | 7.8 | 9.4 | 0.0 | 3.4 | 4.3 | 0.8 | 0.2 | 0.7 | |
| Exhibition | - | - | - | - | - | - | - | - | - | - | - | - | - | |
| Location | Home | 13 | 1 | 8.6 | 2.5 | 7.1 | 9.6 | 8.6 | 0.0 | 3.6 | 4.6 | 0.8 | 0.7 | 0.4 |
| Away | 13 | - | 8.0 | 1.9 | 4.6 | 6.5 | 7.7 | 0.0 | 2.3 | 3.1 | 0.8 | 0.0 | 0.8 | |
| Neutral | 1 | - | 7.0 | 0.0 | 5.7 | 5.7 | 5.7 | 0.0 | 0.0 | 5.7 | 0.0 | 0.0 | 0.0 | |
| Result | Wins | 18 | 1 | 9.1 | 2.4 | 6.8 | 9.3 | 8.5 | 0.0 | 3.4 | 4.4 | 0.8 | 0.5 | 0.5 |
| Losses | 9 | - | 6.6 | 1.4 | 3.4 | 4.7 | 6.8 | 0.0 | 1.4 | 2.7 | 0.5 | 0.0 | 0.7 | |
| Month | November | 2 | - | 13.5 | 5.9 | 5.9 | 11.9 | 1.5 | 0.0 | 1.5 | 3.0 | 0.5 | 1.5 | 0.0 |
| December | 6 | - | 6.0 | 0.0 | 3.3 | 3.3 | 7.8 | 0.0 | 0.0 | 2.2 | 0.0 | 0.0 | 0.0 | |
| January | 9 | 1 | 9.2 | 1.0 | 6.7 | 7.7 | 8.2 | 0.0 | 2.4 | 4.3 | 0.6 | 0.5 | 1.0 | |
| February | 9 | - | 7.4 | 3.0 | 7.2 | 10.1 | 11.3 | 0.0 | 6.0 | 5.4 | 1.1 | 0.0 | 0.6 | |
| March | 1 | - | 10.0 | 4.0 | 0.0 | 4.0 | 4.0 | 0.0 | 0.0 | 0.0 | - | 0.0 | 0.0 |
News Mentions

Dezelski Leads the Way
Charger senior piles up 25 points, 14 rebounds in Hillsdale's 75-59 road win over Lake Erie College
February 13, 2014
Hillsdale Gets Back on the Winning Track
Chargers jump all over Ohio Dominican, winning 87-56
February 8, 2014

Hillsdale Opens in Style
Chargers play first game in refurbished arena, come out with 88-64 win over Lourdes
November 13, 2013
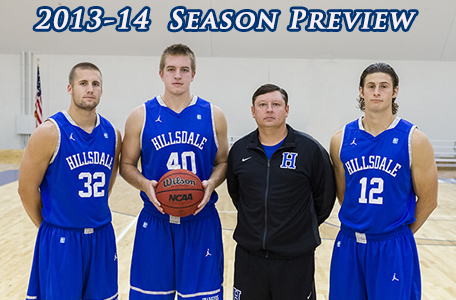
MEN'S BASKETBALL SEASON PREVIEW
Chargers picked 2nd in preseason South Division Poll; Dezelski, Pritzl earn preseason All-Conference honors
November 6, 2013

Nick Washburn to Play Professional Basketball in Spain
6-10 center signed by CB Peñas Huesca, part of the second-highest level pro basketball league in Spain
August 21, 2013